
Truck Parking Club used data from the National Highway Traffic Safety Administration to rank the top 25 cities with the highest accident rates.
This item is available in full to subscribers.
If you are a current print subscriber, you can set up a free website account by clicking here.
Otherwise, click here to view your options for subscribing.
Please log in to continue |
|

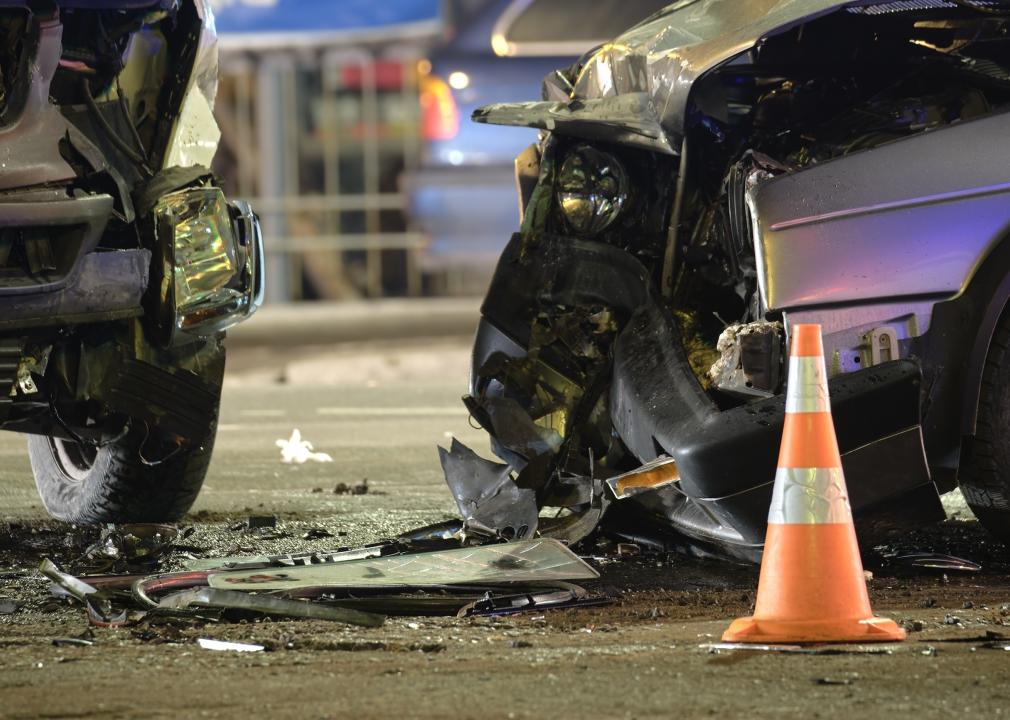
More than 42,000 Americans died in car crashes in 2022, making these accidents a leading cause of death in the U.S.
These deaths occurred during over 39,000 crashes that year—about one crash per 10,000 U.S. residents, according to National Highway Traffic Safety Administration tallies. But in some cities, the roads are even more deadly.
Truck Parking Club used data from the National Highway Traffic Safety Administration to rank the 25 cities with the highest accident rates, measured as accidents per 10,000 residents in 2022. Only cities with at least 10 fatal crashes and 20,000 residents were included in the analysis. Cities without available Census Bureau population estimates were not included.
Fatal car crash rates fell for several decades as federal and state governments adopted safety regulations for vehicle manufacturers and occupants. But rates went up in 2020 and 2021, with increases in fatalities related to alcohol and speeding. When COVID-19 restrictions decreased the number of cars on the road, many drivers adopted risky driving behaviors that have persisted even as traffic returned to normal. While fatalities decreased in 2022, they remain higher than they've been in over a decade.
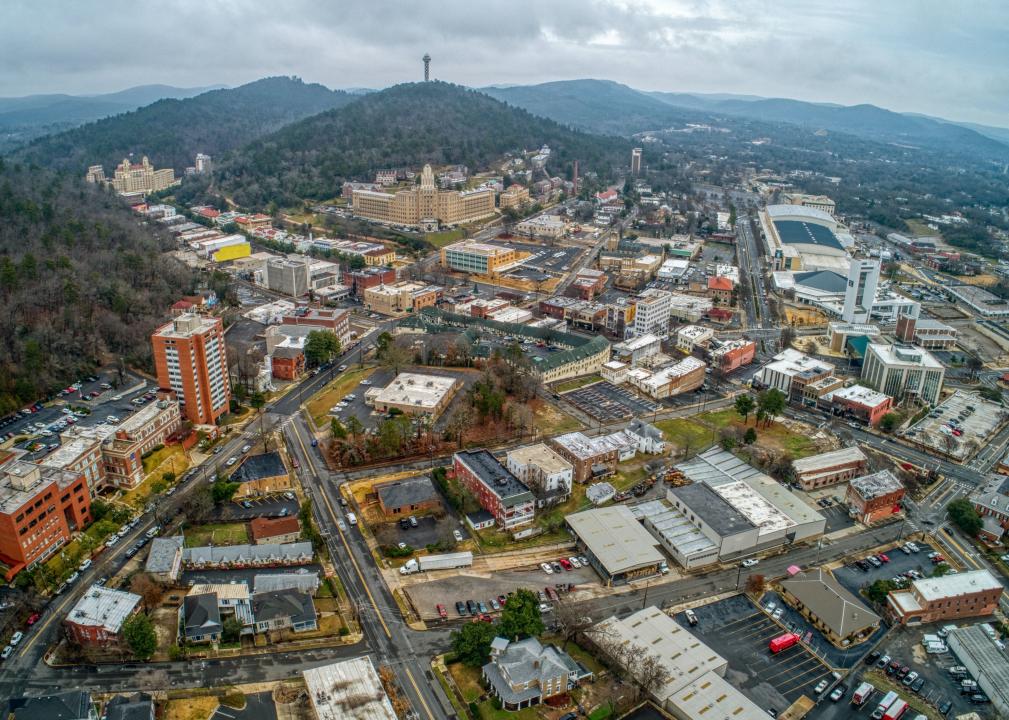
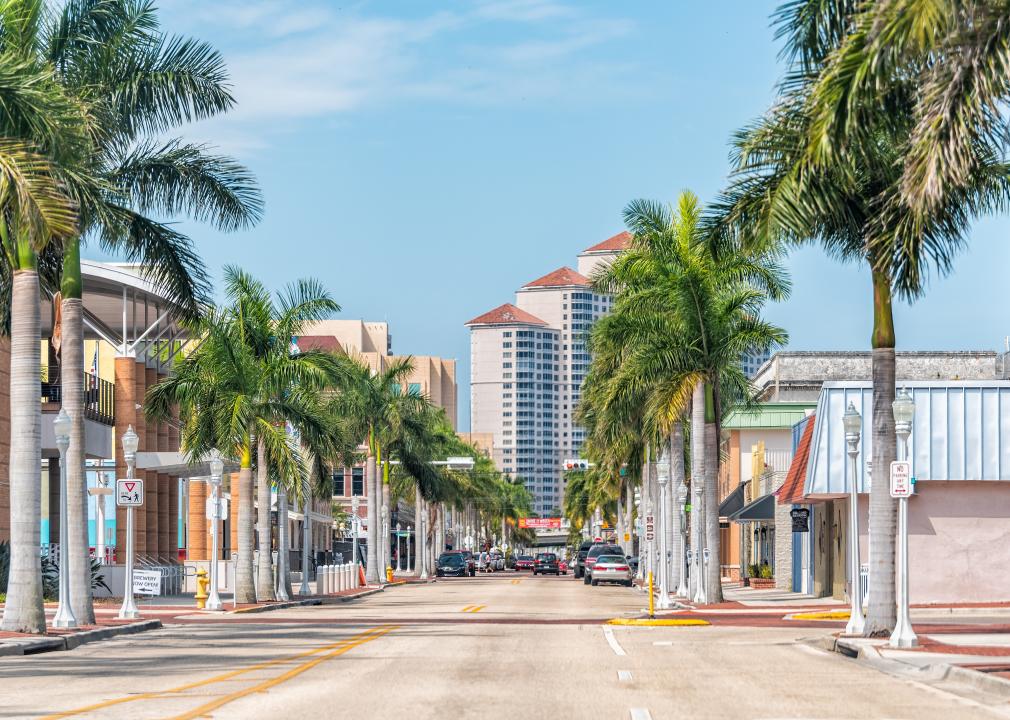
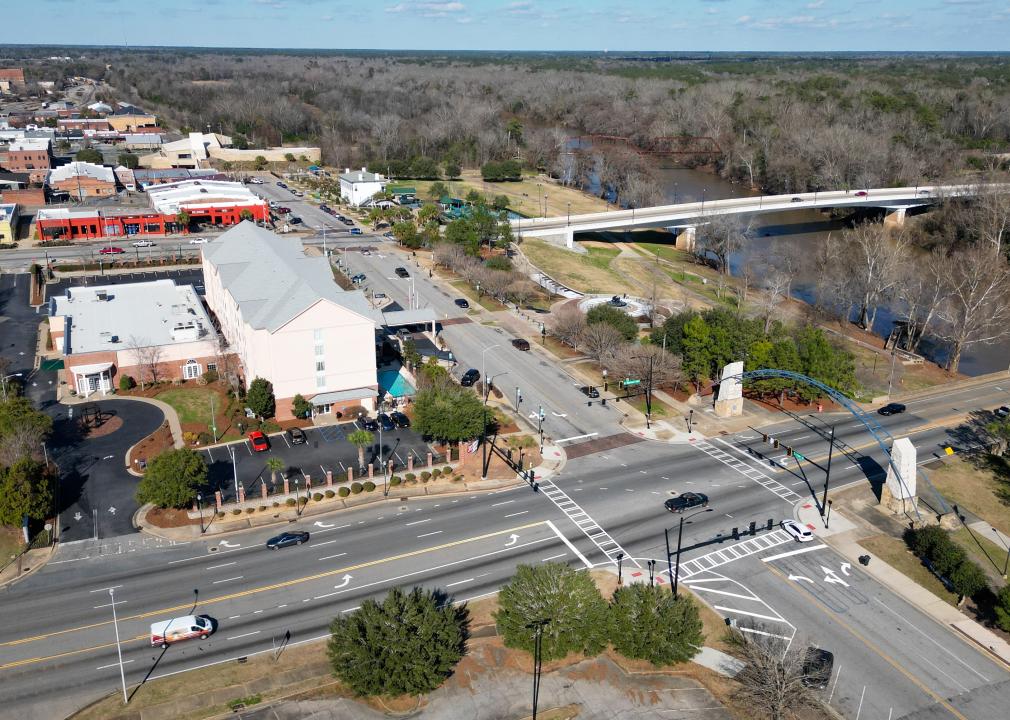
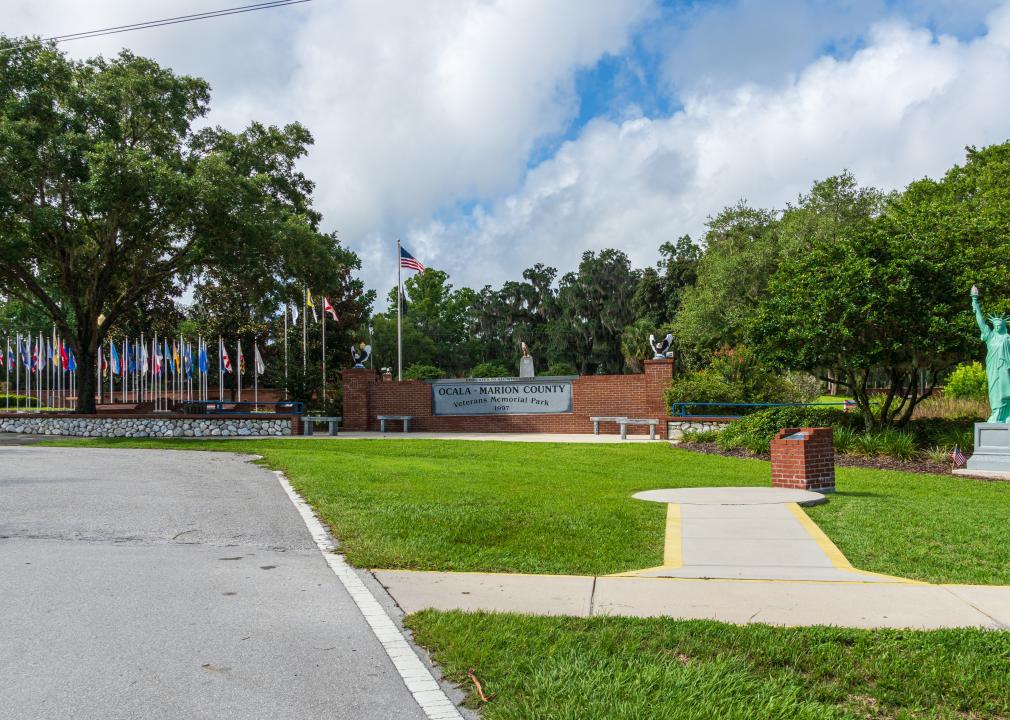
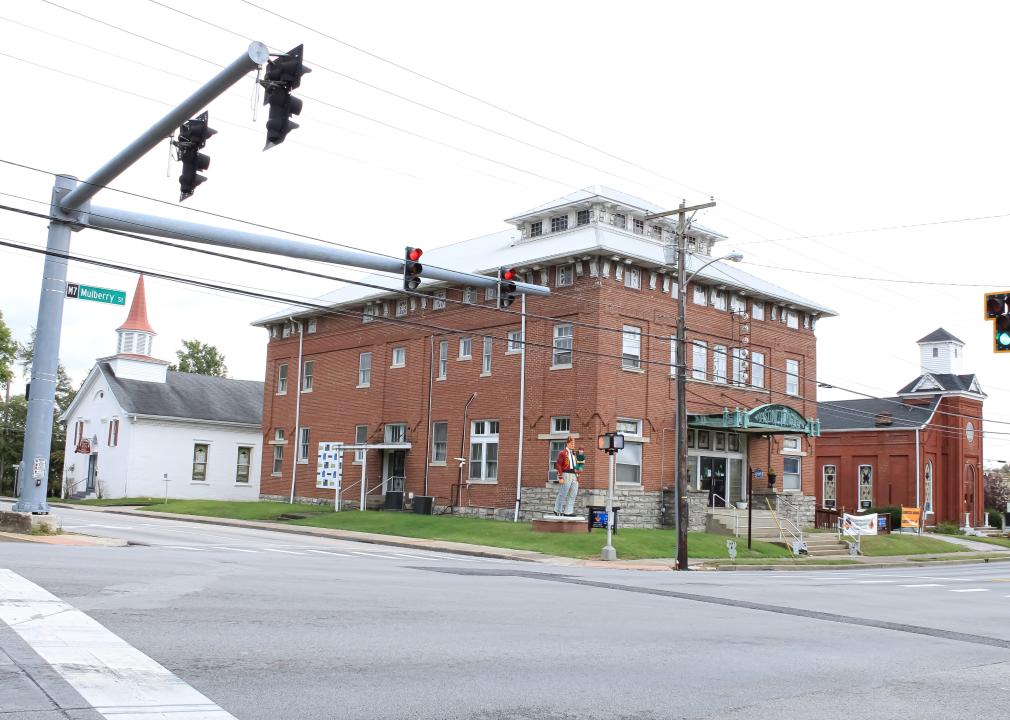
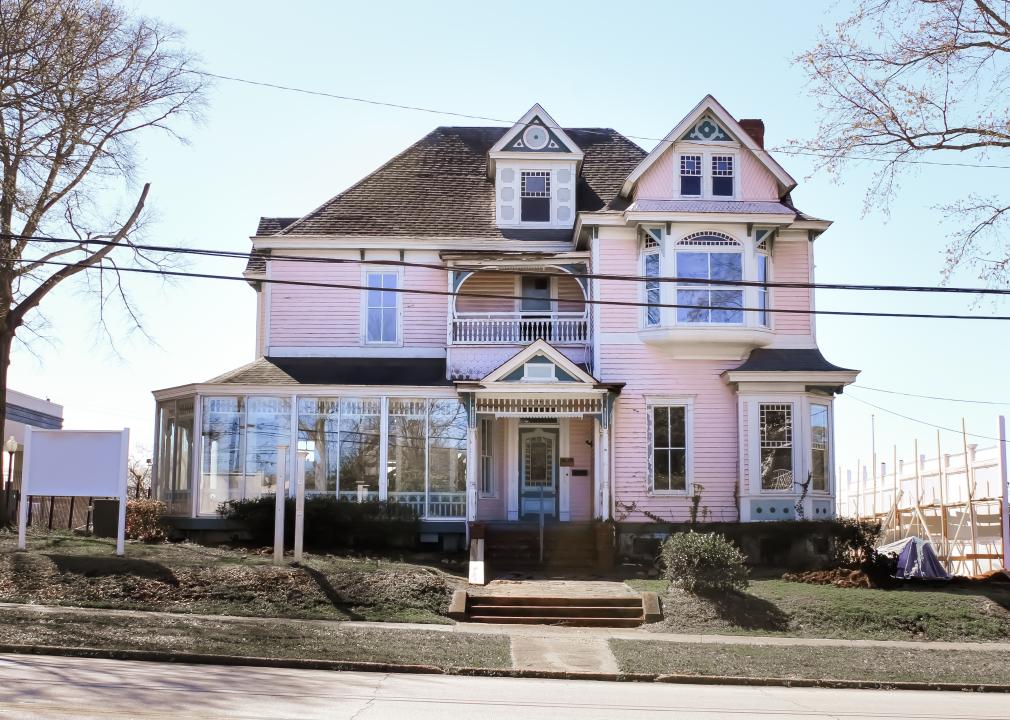
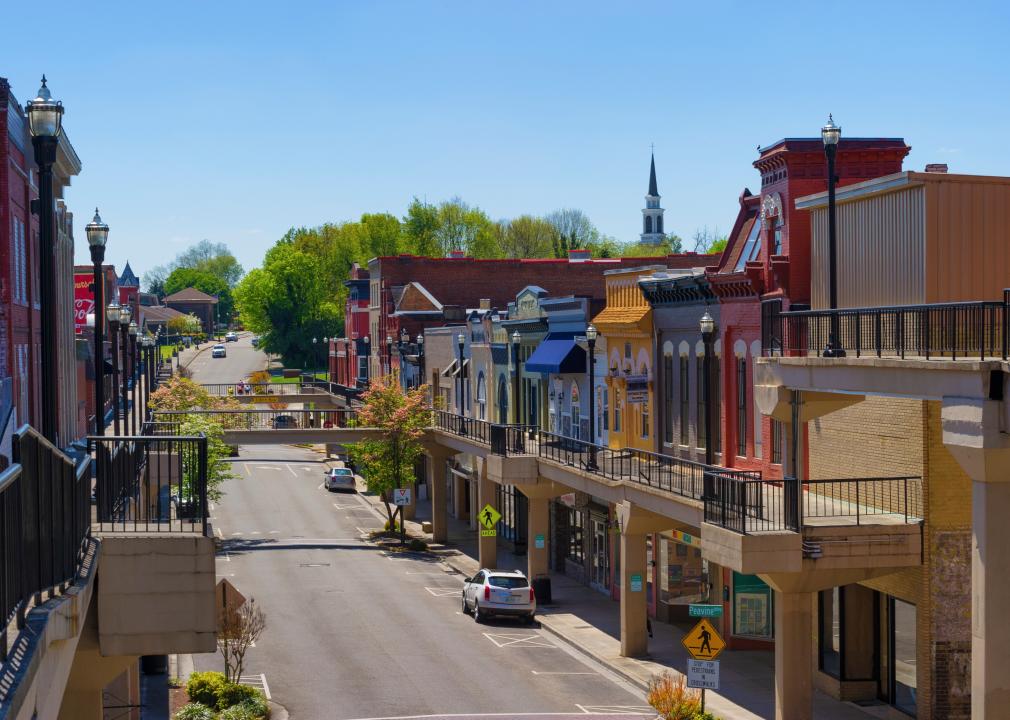
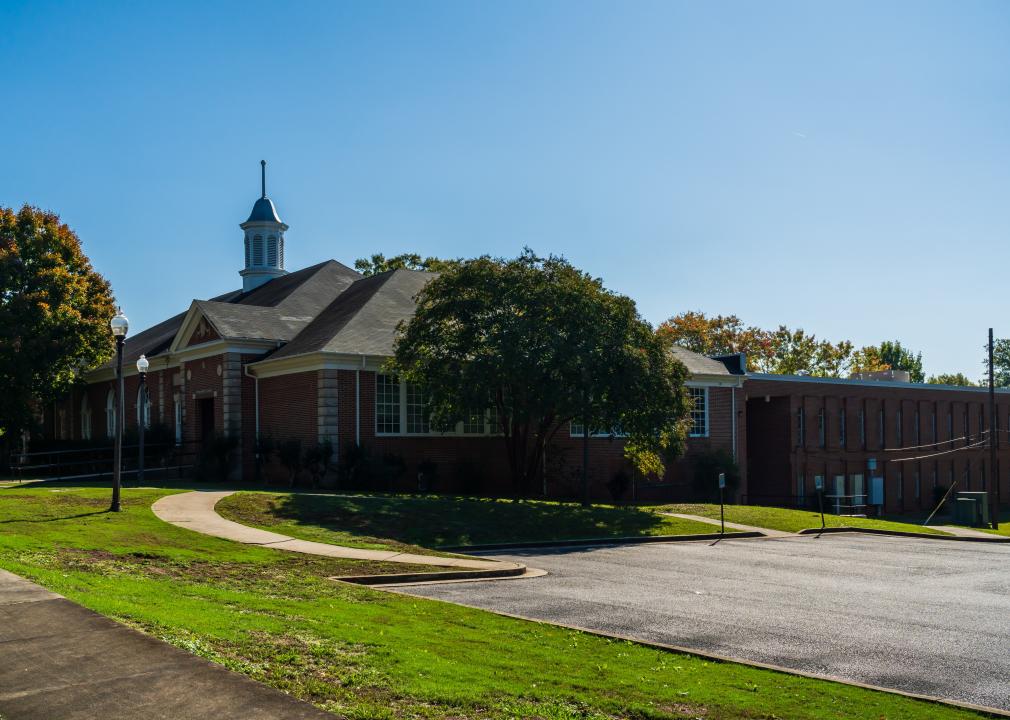
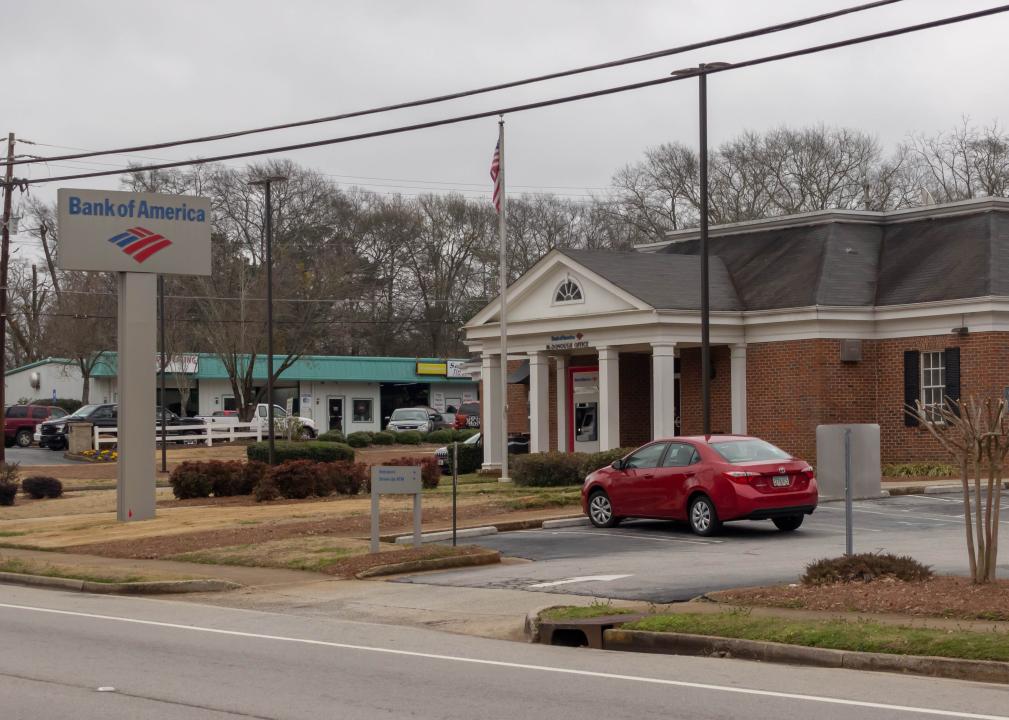
Nearly all of the top 25 cities for fatal crashes were in the Southeast. Most were smaller cities: Over half had populations of fewer than 50,000, while only three had more than 100,000 residents. They also tended to be far from major cities. Geographic hazards exist in most, including hilly terrain, winding rivers, and dense forests. Nearly all have some type of waterfront—rivers, lakes, coasts, and the like—which are likely to pose distractions for drivers taking in the view.
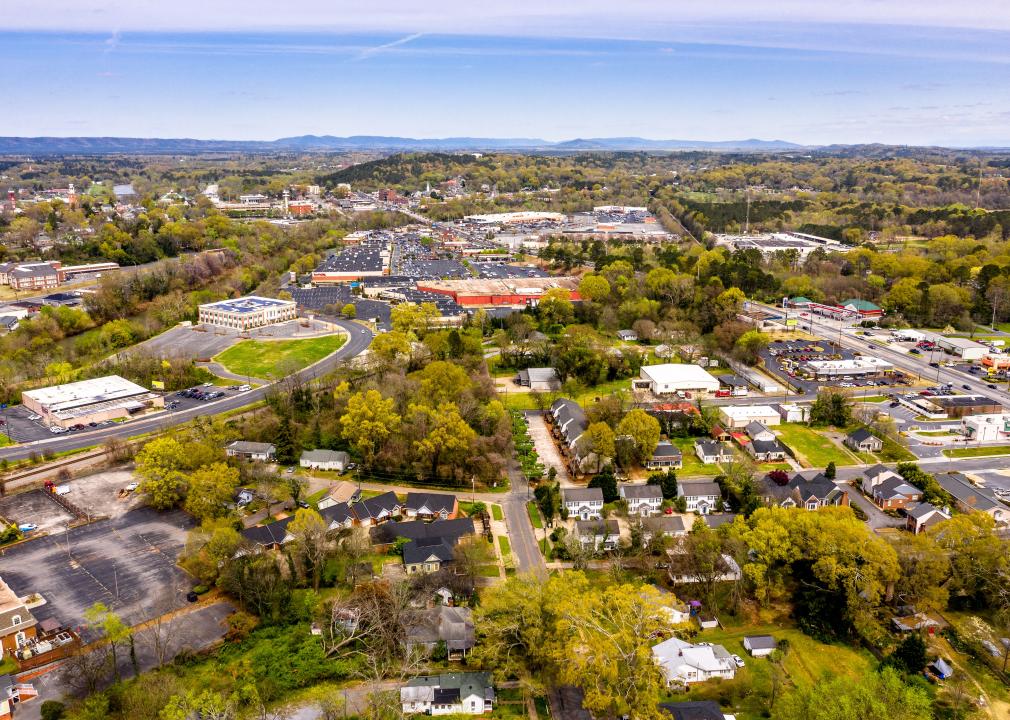
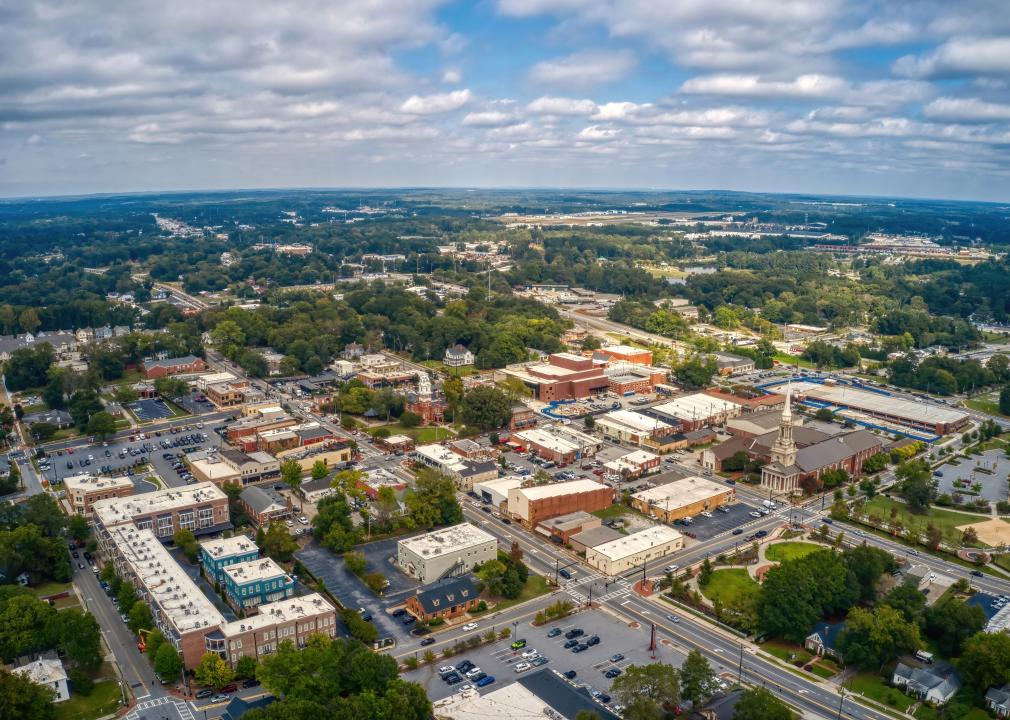
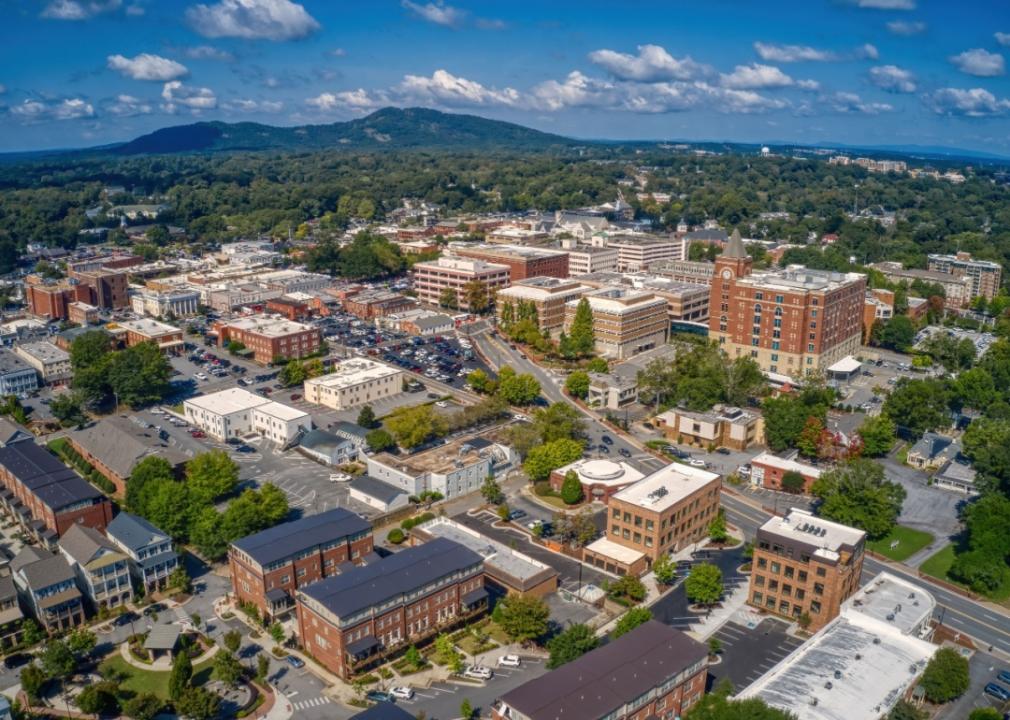
About half of the deadliest cities ranked here are in Georgia—nearly half of which sit within the Atlanta metro area. Though these may be considered suburbs of Atlanta, most are far from the city's downtown. Few are serviced by Atlanta's public transit systems, meaning anyone commuting to the city will almost certainly drive for at least part of their trip. In addition, Atlanta ranks as one of the worst highest-populated cities to drive in, according to a 2024 Forbes analysis. These factors add to the risk of accidents.
Overall, Georgia ranks #14 in traffic fatalities per capita. Georgia Department of Transportation data suggests this is due to speeding, aggressive driving, and people not using seatbelts. Efforts are underway to minimize Georgia's traffic deaths. The state's transportation department received a $2.5 million grant to mitigate and decrease crashes, funding car seat distribution, crash data analysis, and education efforts for drivers over 55. Atlanta's Emory University and Grady Health System also received $4.4 million to study crashes in the metro area and research ways to reduce crashes.
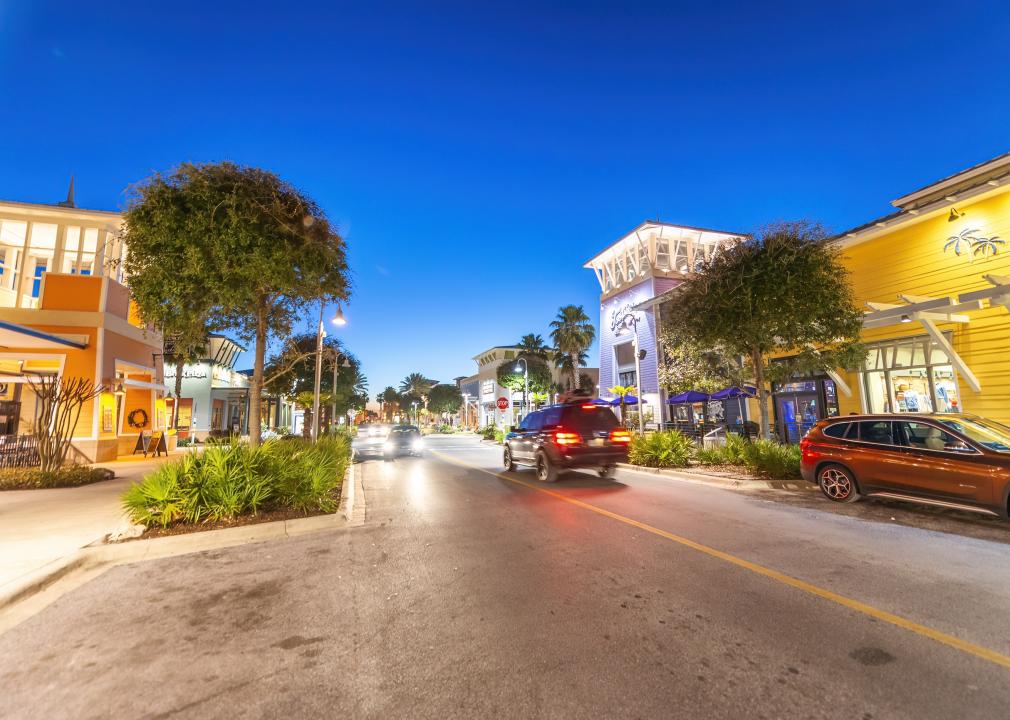
Still, Georgia isn't the full story. There were high-ranking cities for traffic fatalities in most U.S. regions. Read on to learn where.
- Fatal accidents per 10,000 residents: 2.6 (2.2x the national average)
- Total fatal accidents: 10 (11 fatalities)
- Most common crash site: U.S. highways (5 fatal accidents)
- Fatal accidents per 10,000 residents: 2.7 (2.3x the national average)
- Total fatal accidents: 26 (29 fatalities)
- Most common crash site: State highways (11 fatal accidents)

- Fatal accidents per 10,000 residents: 2.8 (2.4x the national average)
- Total fatal accidents: 15 (19 fatalities)
- Most common crash site: Local city streets (7 fatal accidents)
- Fatal accidents per 10,000 residents: 2.8 (2.4x the national average)
- Total fatal accidents: 19 (19 fatalities)
- Most common crash site: State highways (8 fatal accidents)

- Fatal accidents per 10,000 residents: 2.9 (2.5x the national average)
- Total fatal accidents: 53 (54 fatalities)
- Most common crash site: U.S. highways (15 fatal accidents)

- Fatal accidents per 10,000 residents: 2.9 (2.5x the national average)
- Total fatal accidents: 46 (51 fatalities)
- Most common crash site: State highways (21 fatal accidents)
- Fatal accidents per 10,000 residents: 3.1 (2.6x the national average)
- Total fatal accidents: 20 (20 fatalities)
- Most common crash site: State highways (6 fatal accidents)
- Fatal accidents per 10,000 residents: 3.1 (2.7x the national average)
- Total fatal accidents: 10 (10 fatalities)
- Most common crash site: U.S. highways (4 fatal accidents)
- Fatal accidents per 10,000 residents: 3.1 (2.7x the national average)
- Total fatal accidents: 10 (12 fatalities)
- Most common crash site: State highways (5 fatal accidents)
- Fatal accidents per 10,000 residents: 3.2 (2.7x the national average)
- Total fatal accidents: 12 (12 fatalities)
- Most common crash site: State highways (7 fatal accidents)
- Fatal accidents per 10,000 residents: 3.2 (2.7x the national average)
- Total fatal accidents: 10 (10 fatalities)
- Most common crash site: U.S. highways (4 fatal accidents)
- Fatal accidents per 10,000 residents: 3.2 (2.7x the national average)
- Total fatal accidents: 25 (25 fatalities)
- Most common crash site: Local city streets (10 fatal accidents)
- Fatal accidents per 10,000 residents: 3.3 (2.8x the national average)
- Total fatal accidents: 10 (10 fatalities)
- Most common crash site: State highways (4 fatal accidents)
- Fatal accidents per 10,000 residents: 3.3 (2.8x the national average)
- Total fatal accidents: 207 (228 fatalities)
- Most common crash site: Local city streets (111 fatal accidents)
- Fatal accidents per 10,000 residents: 3.5 (3.0x the national average)
- Total fatal accidents: 28 (28 fatalities)
- Most common crash site: Local city streets (24 fatal accidents)
- Fatal accidents per 10,000 residents: 3.7 (3.2x the national average)
- Total fatal accidents: 13 (16 fatalities)
- Most common crash site: State highways (3 fatal accidents)
- Fatal accidents per 10,000 residents: 3.9 (3.3x the national average)
- Total fatal accidents: 14 (14 fatalities)
- Most common crash site: Interstates (5 fatal accidents)
- Fatal accidents per 10,000 residents: 4.0 (3.4x the national average)
- Total fatal accidents: 18 (19 fatalities)
- Most common crash site: State highways (14 fatal accidents)
- Fatal accidents per 10,000 residents: 4.2 (3.6x the national average)
- Total fatal accidents: 10 (10 fatalities)
- Most common crash site: State highways (7 fatal accidents)
- Fatal accidents per 10,000 residents: 4.3 (3.6x the national average)
- Total fatal accidents: 13 (16 fatalities)
- Most common crash site: Local township streets (3 fatal accidents)
- Fatal accidents per 10,000 residents: 4.6 (3.9x the national average)
- Total fatal accidents: 29 (29 fatalities)
- Most common crash site: State highways (7 fatal accidents)

- Fatal accidents per 10,000 residents: 4.9 (4.2x the national average)
- Total fatal accidents: 12 (14 fatalities)
- Most common crash site: County roads (6 fatal accidents)
- Fatal accidents per 10,000 residents: 5.2 (4.4x the national average)
- Total fatal accidents: 18 (19 fatalities)
- Most common crash site: U.S. highways (7 fatal accidents)

- Fatal accidents per 10,000 residents: 5.9 (5.0x the national average)
- Total fatal accidents: 14 (15 fatalities)
- Most common crash site: State highways (8 fatal accidents)

- Fatal accidents per 10,000 residents: 6.0 (5.1x the national average)
- Total fatal accidents: 35 (35 fatalities)
- Most common crash site: State highways (18 fatal accidents)
Story editing by Carren Jao. Additional editing by Kelly Glass. Copy editing by Kristen Wegrzyn. Photo selection by Clarese Moller.
This story originally appeared on Truck Parking Club and was produced and distributed in partnership with Stacker Studio.